Example: Used car purchases
In this example we are going to analyze used car prices with real data extracted from eBay classifieds.
The following problem can occur:
- Real data contains wrong data
- Example:
- 100.000hp car
- Car with a price of 100 million euros
- This data would distort our model
- We have to remove it
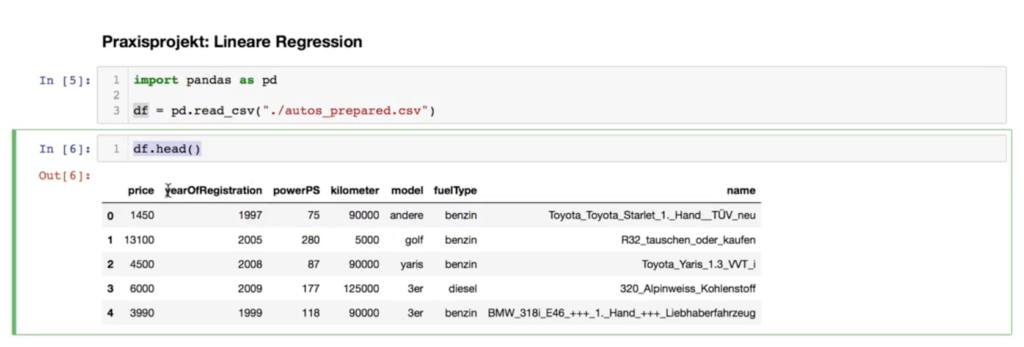
- First we have to read the .csv file. Then we look at the data and we can see how much horsepower, kilometers the cars have, the name etc. In our case we are only interested in the price and kilometers.
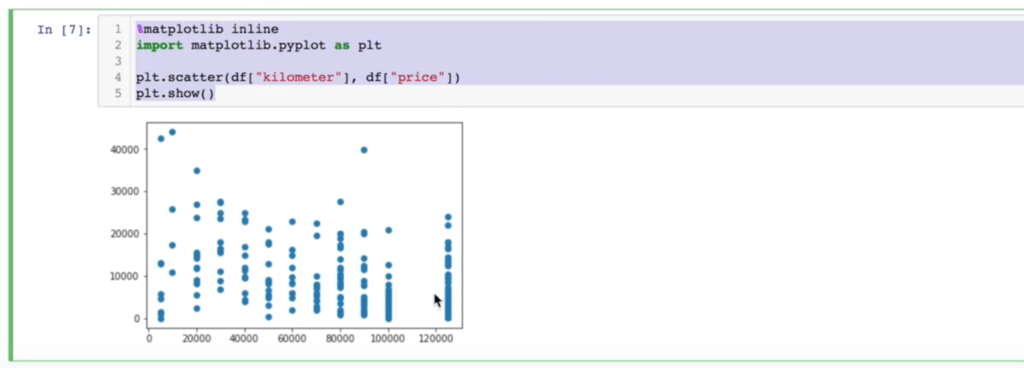
- As a first step, we have our data displayed in the Scatter-Plot. Then we can see all the kilometers and prices.
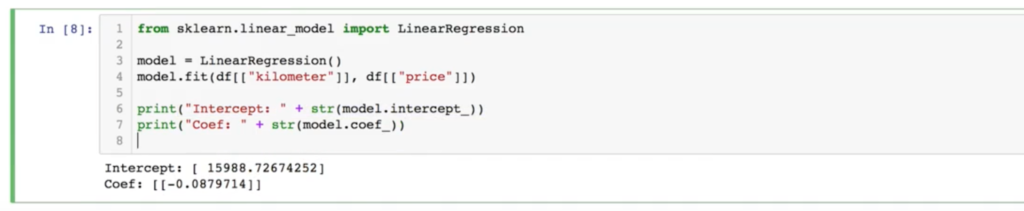
- The next step is to do the linear regression. We import our sklearn library, feed the whole thing with the kilometers as the X value and the price as the Y value (the double square brackets [[ ]] are important because this is the format that linear regression expects) and then we have the intercept and the coefficient output.
- If we want to predict values for our line, then we can say that the lowest value is 0 and the line should go up to the X value of 130,000.

- Now we can draw the whole thing in a graphic. That means show the scatter-Plot again. Then draw a line over our two selected points and select the desired color.
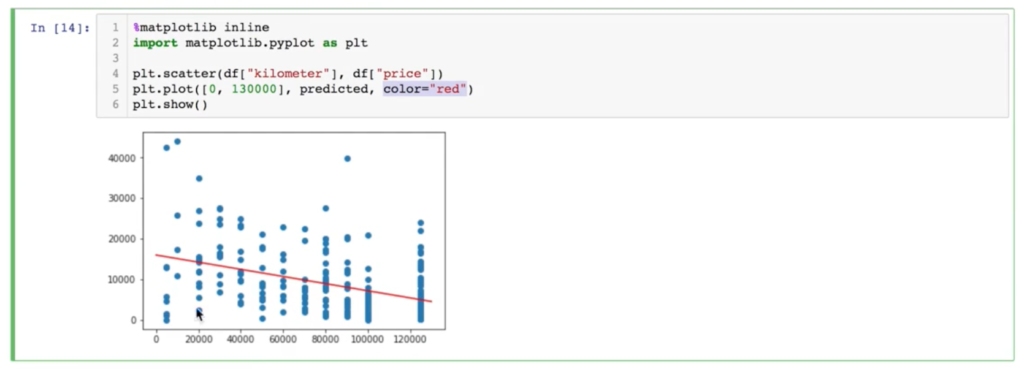
- We can also make a prediction, for example with 50,000km and then we will have as a result € 11,600 which the car is still worth on average with 50,000km.

Next page